

Abstract
While many developed countries are increasing their forest cover, deforestation is still rife in the tropics and subtropics. With international trade in forest-risk commodities on the rise, it is becoming increasingly important to consider between-country trade linkages in assessing the drivers of—and possible connections between—forest loss and gain across countries. Previous studies have shown that countries that have undergone a forest transition (and are now increasing their forest cover) tend to displace land use outside their borders. However, lack of comprehensive data on deforestation drivers imply that it has not been possible to ascertain whether this has accelerated forest loss in sourcing countries. To remedy this, we present a land-balance model that quantifies deforestation embodied in production of agricultural and forestry commodities at country level across the tropics and subtropics, subsequently tracing embodied deforestation to countries of apparent consumption using a physical, country-to-country trade model. We find that in the period 2005–2013, 62% (5.5 Mha yr−1) of forest loss could be attributed to expanding commercial cropland, pastures and tree plantations. The commodity groups most commonly associated with deforestation were cattle meat, forestry products, oil palm, cereals and soybeans, though variation between countries and regions was large. A large (26%) and slightly increasing share of deforestation was attributed to international demand, the bulk of which (87%) was exported to countries that either exhibit decreasing deforestation rates or increasing forest cover (late- or post-forest transition countries), particularly in Europe and Asia (China, India, and Russia). About a third of the net forest gains in post-forest transition countries was in this way offset by imports of commodities causing deforestation elsewhere, suggesting that achieving a global forest transition will be substantially more challenging than achieving national or regional ones.
Export citation and abstract BibTeX RIS

Original content from this work may be used under the terms of the Creative Commons Attribution 3.0 licence. Any further distribution of this work must maintain attribution to the author(s) and the title of the work, journal citation and DOI.
1. Introduction
Deforestation is one of the largest sources of greenhouse-gas emissions [1] and causes other environmental impacts at local to regional scale, including the loss of habitats and associated species extinction risks [2]. However, deforestation trends vary significantly across the world. While forests are lost at a rate of about 10 Mha yr−1 across the tropics and subtropics [3], in many (primarily developed) countries, forest cover is increasing [4]. Recent years have brought attempts at halting deforestation, and some tropical countries, most notably Brazil, have seen declining deforestation rates.
Recent international commitments are aiming to amplify these positive trends: the New York Declaration on Forests sets the goal of halving tropical deforestation; the United Nations' Sustainable Development Goals (SDGs) calls for a complete halt to deforestation; and the Bonn Challenge aims for the restoration of 150 million hectares of cleared or degraded forests—all of this already by 2020. What these initiatives aim for is a rapid global forest transition.
Forest transitions—denoting a process through which a region moves from net loss to net gain of forest area [5]—have occurred in many countries, driven primarily by economic development, creating off-farm employment that pulls labor away from the agricultural sector, and/or by forest scarcity, leading policy makers to respond to negative impacts from forest loss by re-establishing forests [6]. However, these processes—showing large variations across countries and regions—are by no means inevitable or universal [7] and with land use across the world becoming increasingly integrated via international trade [8], trends in forest loss and gain can no longer simply be explained by national dynamics, but are rather the result of complex drivers across scales, from local to global [9]. Pfaff and Walker [10] argue that local forest transitions may be facilitated by forest loss shifting to other regions, through increased imports of forestry and/or agricultural products. They illustrate this with the historic forest transition in the North-eastern United States (US), which in part was made possible through increase imports of food and timber from other parts of the US. Along similar lines Meyfroidt et al [11, 12] and Kastner et al [13] show that many countries in both the tropics and non-tropics that have undergone a forest transition simultaneously increased imports of land use (and carbon) embodied in forestry and agricultural commodities.
However, while these studies show that forest transition countries tend to displace land use outside their borders, they have not established whether this has caused increased deforestation in sourcing countries. The net effect of these forest transitions on global forest area therefore remains an open question. The main reason for this is the lack of comprehensive data on deforestation drivers, making it impossible to estimate deforestation embodied in global agricultural and forestry commodity trade. While some recent studies have linked deforestation to agricultural and forestry commodity production and trade [14–16], the coverage of these studies—spatially and in terms of commodities covered—has been limited, not allowing for a full understanding of the links between forest transitions, trade and net change in forest area.
Here, we aim to shed some light on the question of to what extent countries with net forest gain, or with declining rates of deforestation, are importing commodities that have caused deforestation elsewhere. We do this, first by presenting a model that quantifies to what extent agricultural commodities and tree plantations are associated with deforestation and, second, by linking this data to a global trade model to examine what role international trade in agricultural commodities has on redistributing pressures on forests. In doing so, we seek to answer the following questions: where and to what extent do different agricultural and forestry commodities contribute to deforestation? What proportion of these are destined to meet international versus domestic demand? Where are the exported commodities consumed? And finally, to what extent have forest transitions, through reforestation and/or reduced deforestation, been enabled at the expense of deforestation elsewhere?
2. Methods and data
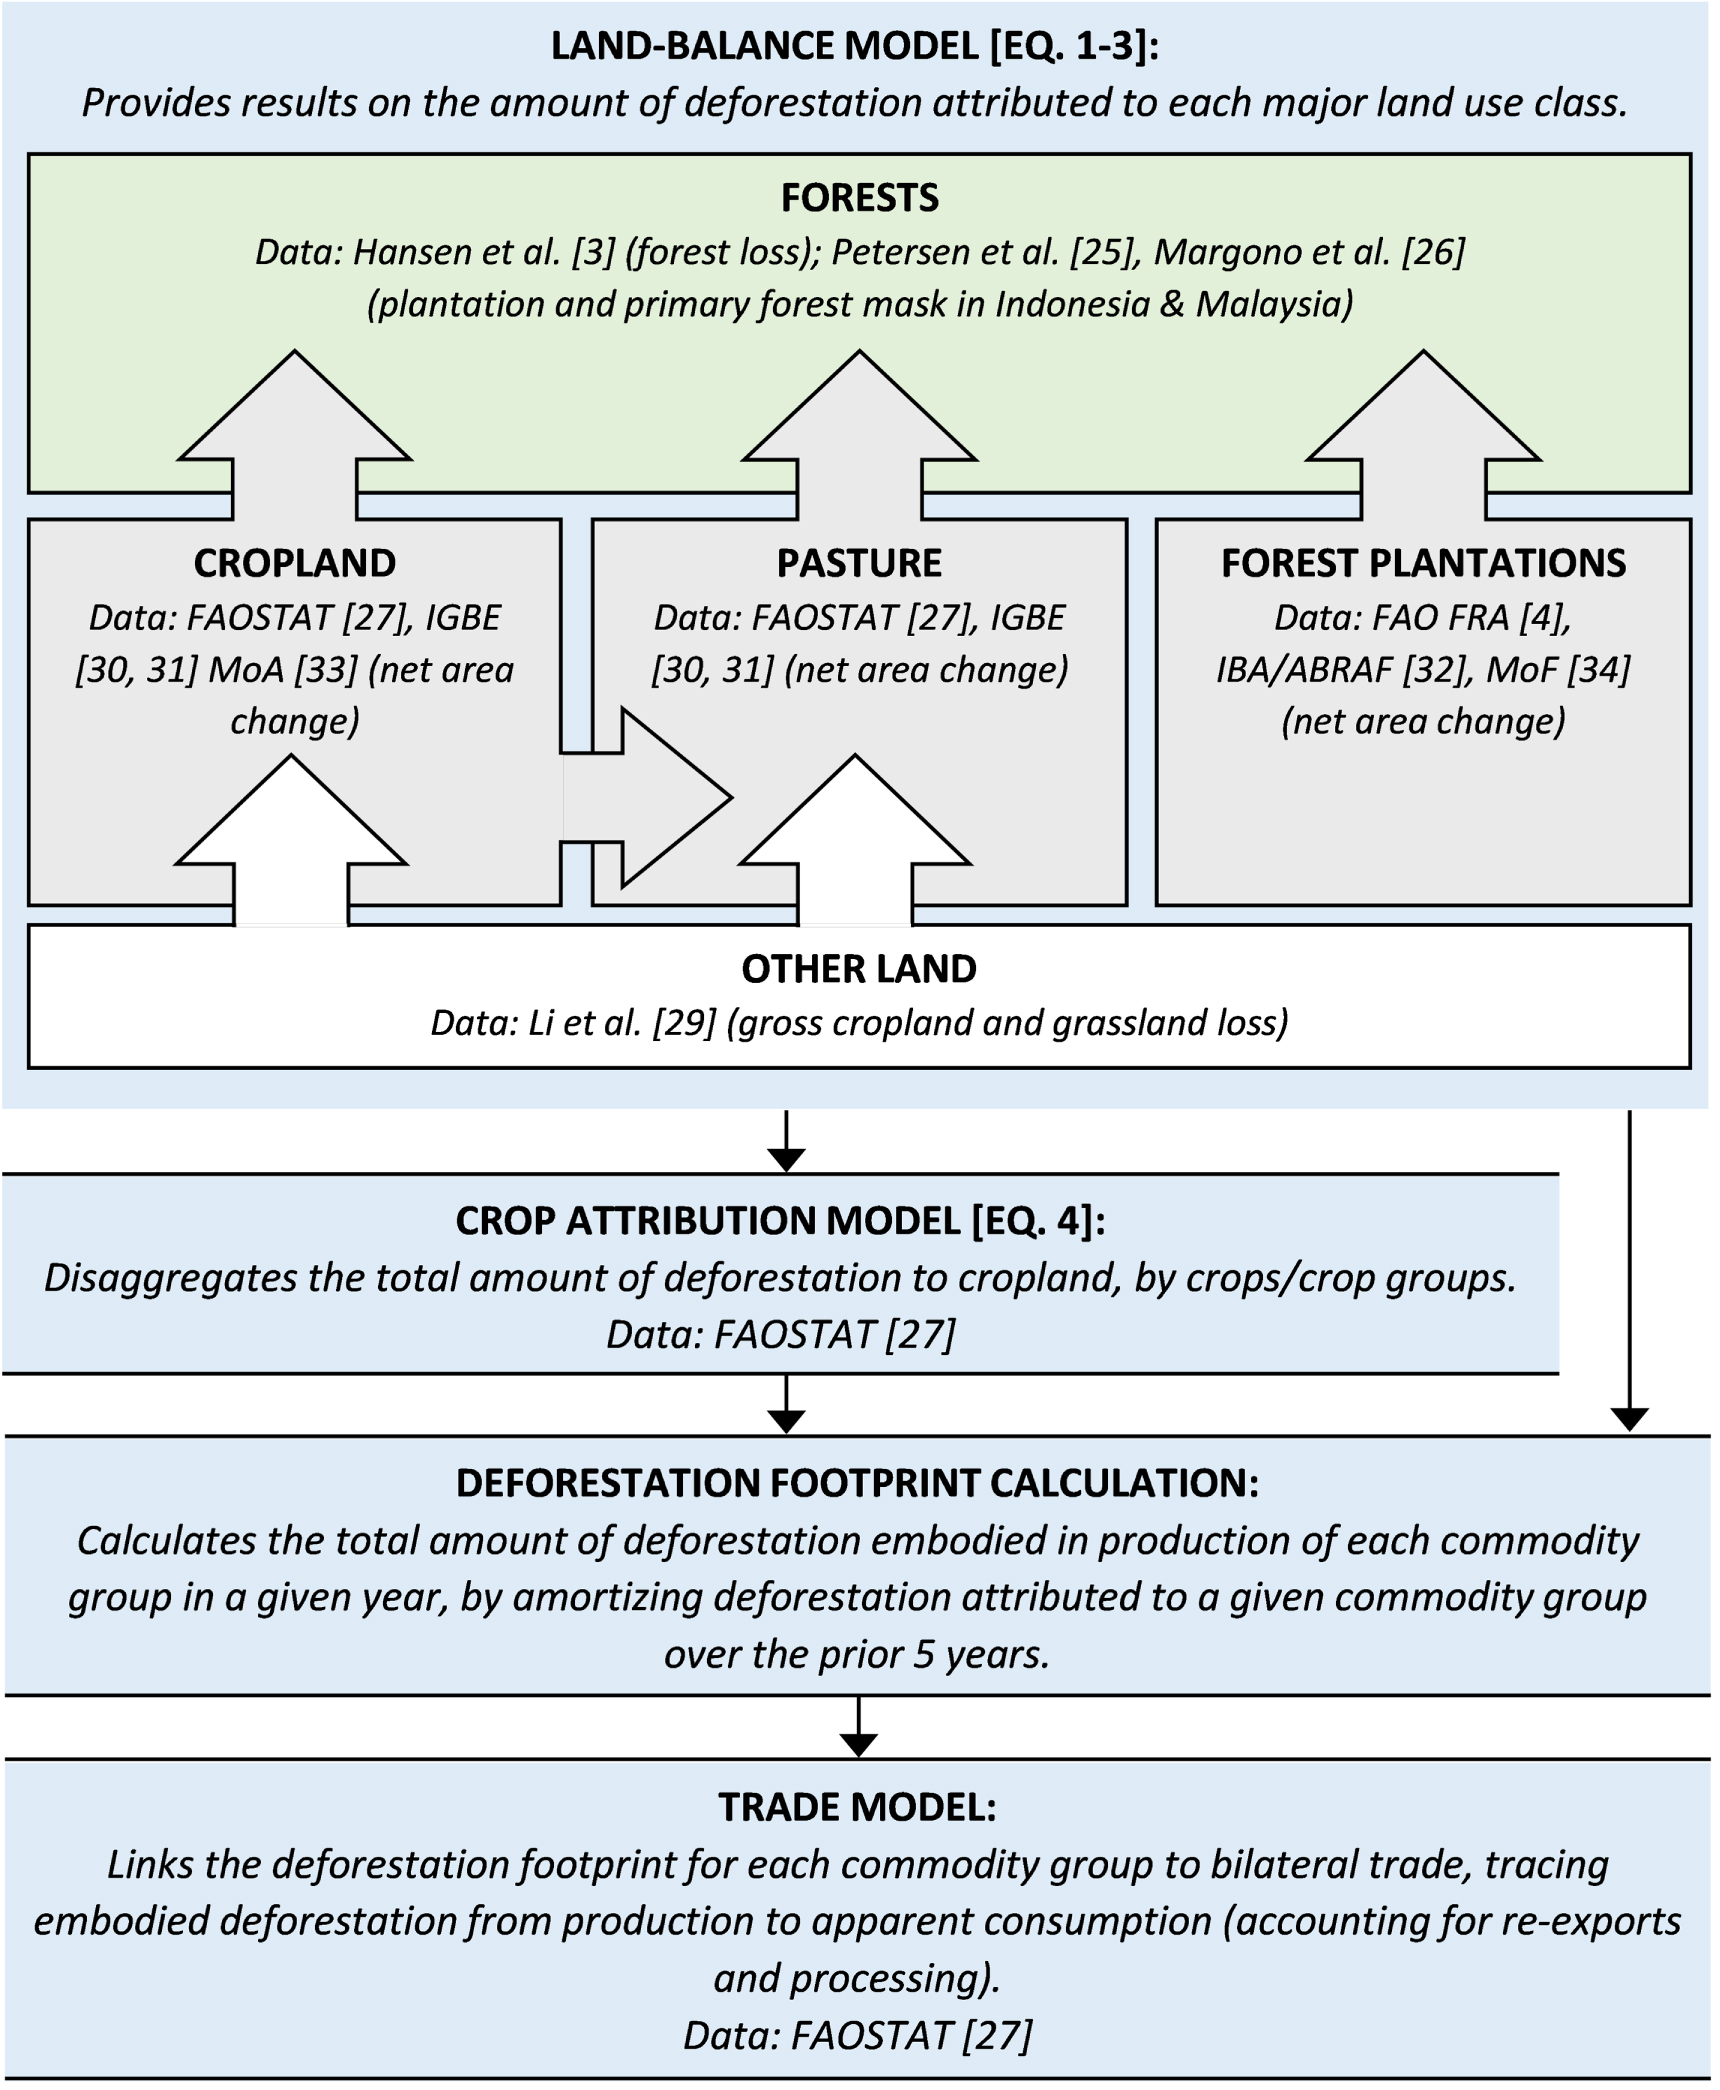
The method used for attributing deforestation to agricultural and forestry production, trade, and consumption, as well as the main data sources, are summarized in figure 1. Below we detail the main steps of the analysis—the land-balance model used for attributing deforestation first to major land-uses and then to commodities, and the bilateral trade model used for tracing embodied deforestation to consumer countries—as well as the classification scheme used to assess flows of embodied deforestation between countries at different stages of the forest transition.
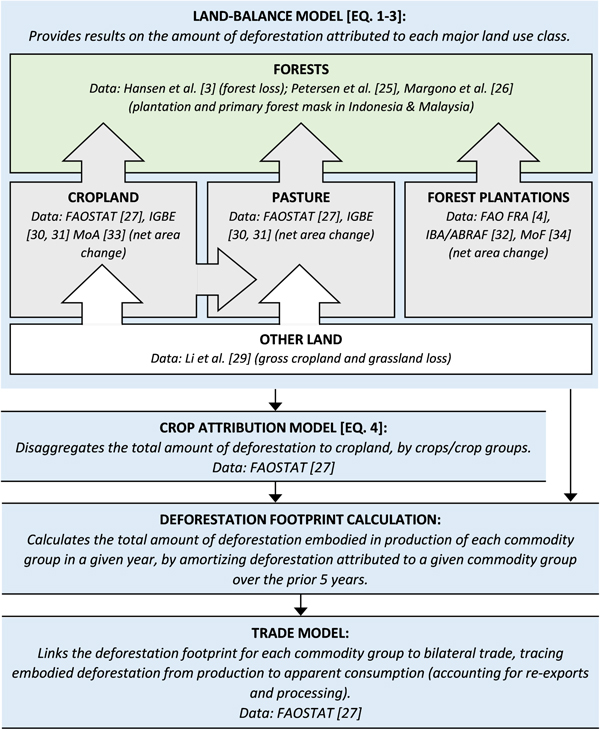
Figure 1. Overview of the main steps of the analysis linking deforestation to agricultural and forestry production, trade, and consumption, as well as the main data sources used for the analysis.
Download figure:
Standard image High-resolution image2.1. Land-balance model
We attribute observed forest loss to agricultural and forestry commodities using a simple land-balance model encompassing cropland, pastures, forest plantations and (indirectly) other land uses. The model is implemented at national level, except for Brazil and Indonesia, where it is implemented at subnational level in order to capture geographically divergent drivers of deforestation in the countries that both hold a large share of remaining tropical forests, but also account for a large share of tropical forest loss. The model is based on two main premises: (1) where cropland expands, it first expands into pastures (if there was a gross loss of pasture area) and then into forests (if there was gross forest loss), and (2) where pastures and forest plantation areas expand, they primarily replace forest land. While simple, these premises are consistent with data showing that forests and other native vegetation (such as woodlands and shrublands) are the main sources of new agricultural land in the tropics [17], that the expansion of forest plantations tend to come at the expense of natural forests [18–21], but also that (at least in the tropical Americas) pastures are a significant source of new cropland [17, 22]. We thus argue that the land-balance model captures the predominant deforestation-related land-use transitions across the tropics.
More specifically, the land-balance model attributes forest loss in a given country or subnational region proportionally to the expansion of cropland (net of pasture loss), pasture and forest plantations, capped at total estimated forest loss in the region. Formally, observed forest loss,  in a given year (t) is attributed to expanding cropland (
 ), permanent pastures
  and forest plantations (
 ) in the following manner:


Here  denotes gross pasture loss and
 the expansion of cropland, permanent pastures and forest plantations respectively (i.e. these variables are zero where these land classes are shrinking).
2.2. Crop attribution model
Forest loss attributed to cropland expansion ( ), is further allocated to individual crops or crop group aggregates (i), in relative proportion to their expansion in area (
 ) (e.g. if areas planted to soybeans account for half of the total cropland expansion in a country, half of the country's cropland deforestation will be attributed to the country's soybean production5
), according to the following:
) (e.g. if areas planted to soybeans account for half of the total cropland expansion in a country, half of the country's cropland deforestation will be attributed to the country's soybean production5
), according to the following:

We attributed and tracked deforestation embodied in production and trade individually for the main forest-risk commodities—cattle meat, soybeans, palm oil and forestry products (from tree plantations)—but group other crops into ten major crop categories, following FAO (the Food and Agriculture Organization of the United Nations): cereals (tracking rice separately, as this is a major crop in tropical regions), other oilseeds, pulses, roots and tubers, vegetables, fruits, tree nuts, fiber crops, and other crops (see table S1 which is available online at stacks.iop.org/ERL/14/055003/mmedia for a full list of all crops included in each category). The latter category mainly includes typical tropical cash crops, such as tea, coffee, cacao and spices, as well as sugar cane.
2.3. Deforestation footprint calculation
Based on empirical evidence on time lags between forest clearing and establishment of soy in Brazil [23] and oil palm plantations in Southeast Asia [20], we chose to average changes in area of cropland, crop group, permanent pastures and tree plantations over the three years following the forest loss. Moreover, to account for that, while deforestation is a one-time event, the cleared land typically yields agricultural and forestry commodities over many years (for perennial and short rotation crops with a time-lag before the first harvest), the attributed deforestation was amortized over a number of years' production [24]: i.e. the deforestation attributed to a given land use is spread equally over production from that land in T years following the deforestation event, which means that the total amount of deforestation embodied in production of a given commodity in a given year is calculated as the total deforestation attributed to the land use producing that commodity in the T previous years, divided by T (where T is the amortization time). Here, to get a longer time series, enabling us to analyze decadal trends, we use a relatively short amortization period of 5 years (results for 1 and 10 years amortization period are given in table S2 and figure S2, which shows that overall the difference between 5 and 10 year amortization is small).
2.4. Input data, country selection and limitations
The forest loss data used was a spatially-explicit dataset over gross tree cover loss (based on remote-sensing data at approximately 30 m resolution) updated from Hansen et al [3]. This provided annual information on tree cover loss for the period 2001–2014. In these data, forests (pre-forest loss) are defined solely on the physical characteristics of the tree cover (i.e. land cover, rather than land use), based on the (year 2000) canopy cover prior to forest loss [3]; here we applied a minimum threshold of 25% canopy cover to define the forests. (Results for 10% and 75% canopy cover shown in the supplementary materials, see figures S3 and S4.) Forest loss is subsequently defined as a complete loss of tree cover at the pixel scale [3].
The physical forest loss definition employed by Hansen et al [3] includes loss of both natural forests and the harvesting of planted forests. Thus, we only present results for a subset of 156 primarily tropical and subtropical countries (figure S1), as this is where agriculture is primarily expanding into native vegetation [17]. We further excluded forest loss within tree plantations in Malaysia and Indonesia, where the Hansen et al [3] data is known to include rotational clearing [25, 26] (further details in supplementary methods).
National level data on cropland and permanent pasture areas, as well as harvested area for the 12 crops/crop groups, in 2000–2014, were taken from FAOSTAT [27]. We assume that pasture expansion into forests is primarily for extensive cattle grazing for meat production, in line with the approach of Opio et al [28]. To estimate gross expansion of cropland and pasture, we add estimates of gross losses of grasslands (assumed to approximate pasture loss) and cropland from remote sensing data [29] to the net changes in area.
Forest plantation area data at the national level were also from FAO [4]. An annual time series was created by interpolation of data available in 5 year intervals (2000, 2005, 2010, and 2015). For forest plantation area we only assess net area changes, as there were no data on gross loss for this land-use class.
Given that the approach for attributing forest loss to agricultural and forestry commodities employed here (equations (1)–(4)) is non-spatial, it cannot differentiate between expansion of land uses directly into forests and expansion that pushes another land use into forests (often termed indirect land-use change). However, we take two steps that help identifying the direct deforestation drivers. First, by using estimates of gross cropland and pasture expansion in equation (1), we aim to capture the (in tropical America) common land use transition of cropland expanding into pastures, indirectly pushing cattle ranchers into forest frontiers, allocating forest loss to expanding pastures where this is occurring. Second, while indirect effects may occur at all spatial scales, the mixing of direct and indirect drivers is likely more prominent the larger the spatial unit at which equations (1)–(4) is evaluated (as spatial information is aggregated and lost). We therefore run the land-balance model at subnational level for Brazil and Indonesia, which together accounted for 40% of tropical forest loss in 2001–2014 [3].
For the subnational analysis of Brazil and Indonesia data on agricultural and forest plantation area were collated at microregion (n = 558) and province (n = 34) level, respectively. For Brazil, agricultural and forest plantation statistics were primarily taken from the Brazilian Institute of Geography and Statistics (IBGE) [30, 31] and the Brazilian Tree Industry (IBA and ABRAF) [32]. For Indonesia, data were taken from the Ministry of Agriculture [33] and the Ministry of Forestry [34].
Our land-balance model does not cover some other land uses that also involve tropical deforestation, such as mining [35], expansion of urban settlements [36], and infrastructure [37]. However, the direct contribution of these land uses to deforestation is in most instances small, their major impact being indirect, through the opening up of forest to colonization or pushing other land uses into forests. We aim to capture such indirect land-use changes in our model, by using assessments of gross expansion of cropland and pastures. More importantly, however, our model does not capture forest clearing for timber without successive establishment of cropland, pastures or tree plantations. While timber extraction can be an important driver of deforestation and forest degradation in some countries, the lack of a clearly delineated land use following forest loss makes this driver difficult to quantify [14]. Our model may also insufficiently capture the role of small-scale and subsistence farming in deforestation, due to non-commercial production being excluded from many countries' official agricultural statistics [38], something we test for in our analysis.
2.5. Trade model
After allocating deforestation to crops, cattle meat and forestry products, we used a physical trade model to assess the country-to-country trade flows of the embodied deforestation (for details on the physical trade model itself, see [8, 39]). The model is based on bilateral trade data as reported to FAOSTAT [27] for ∼400 primary and processed agricultural and forestry products, as well as on production data for 130 crop commodities, 7 primary livestock products and industrial roundwood. Trade flows were considered for most countries in the world (figure S1).
The products are tracked to the country where they are physically consumed as food or in industrial processes. Crop products used as livestock feed are traced through indirect trade in traded animal products. The model also accounts for multi-country supply chains and processing; for example, it includes trade in bread and pasta. Trade of highly-processed products, such as frozen pizzas, is excluded as this data is not available in FAOSTAT. To identify the production-to-consumption trade links, processed products were converted into physical units of primary commodity equivalents. To avoid double counting, we perform this conversion based on the carbon content of the products. This implies that each carbon molecule originating from a given primary product will get the same weight. We cross-checked the resulting conversion factors with available information on typical conversion efficiencies for main agricultural products [40]. The trade data in primary equivalents were integrated with national level production data for the primary commodities. This enabled us to establish clear links between countries of production and countries of consumption, based on the crucial underlying assumption that exports and consumption are met proportionally by imports and domestic production. For a mathematical formulation of the trade model we refer to Kastner et al [39].
The physical units of the trade flows were then converted into embodied cropland (i.e. land use; based on crop yield data from FAOSTAT [27]) and embodied deforestation (based on the model described in section 2.1) based on an assumption of proportionality (i.e. if X% of the production of soy in country A is consumed in country B, then X% of soy cropland and deforestation in country A is embodied in exports to country B).
2.6. Country characteristics—forest transitions
We categorized all countries into four classes6 intended to represent the main stages of a forest transition [5], following Hosonuma et al [42]: countries exhibiting low deforestation rates are classified as pre- or post-transition depending on whether forest cover is high or low (or if net reforestation is occurring); countries with high deforestation rates are classified as early-transition if gross deforestation is increasing and remaining forest cover is not too low, and late-transition otherwise. We tested the decision algorithm for robustness and found that it was mainly sensitive to the threshold for high/low deforestation rate. After cross-checking the classification with literature [7, 43], we decided to use a slightly lower threshold than Hosonuma et al [42] (see figure 2(a) for an exact description of the final classification algorithm). We also manually adjusted the classification for a few post-transition countries that were not classified as such7 and excluded countries with less than 5% forest cover.

Figure 2. (a) Schematic representation of the forest transition, with the decision algorithm used to classify countries into four stages: pre-, early-, late-, and post-transition. FC = forest cover; ΔFC = net forest cover change; ΔGFL = trend in gross forest loss (deforestation). (b) Map showing countries classified into forest transition stages. Countries marked as 'unclassified' are primarily those with a forest cover below 5%.
Download figure:
Standard image High-resolution imageFor this classification, data on forest cover (2015) and net forest cover change (2005–2015) were taken from the FAO Global Forest Resources Assessment [4]. Trends in gross forest loss were estimated as annual averages (2005–2014) from a simple OLS regression on updated country-level forest loss data from Hansen et al [3]. The number of countries in each stage, by region, and their main characteristics are summarized in table 1 and the full classification is shown in figure 2(b).
Table 1. Number of countries and main characteristics of forest transition stage groupings (see figure 2 and text for classification scheme), by region. Note that, as the data on gross forest loss does not distinguish between natural and planted forests, post-transition countries, while gaining forest area in total, exhibit large gross forest losses due to e.g. rotational felling in production forests.
| No. | Forest areaa | Net forest changea | Gross forest lossb | |
|---|---|---|---|---|
| 2015 | 2005–2015 | 2001–2014 | ||
| Forest transition stage | ( ) | (Mha) | (Mha yr−1) | (Mha yr−1) |
| 1. Pre-transition | 12 | 97 | 0.0 | 0.1 |
| Tropical Americas | 6 | 41 | 0.0 | 0.0 |
| Tropical Africa, Middle East and Europe | 2 | 22 | 0.0 | 0.0 |
| Tropical Asia and Pacific | 4 | 34 | 0.0 | 0.1 |
| Non-tropics | 0 | 0 | 0.0 | 0.0 |
| 2. Early-transition | 28 | 646 | −3.4 | 3.2 |
| Tropical Americas | 6 | 150 | −0.9 | 0.8 |
| Tropical Africa, Middle East and Europe | 15 | 362 | −1.4 | 1.2 |
| Tropical Asia and Pacific | 7 | 134 | −1.1 | 1.2 |
| Non-tropics | 0 | 0 | 0.0 | 0.0 |
| 3. Late-transition | 27 | 893 | −4.7 | 4.2 |
| Tropical Americas | 11 | 650 | −2.7 | 3.6 |
| Tropical Africa, Middle East and Europe | 11 | 109 | −1.5 | 0.3 |
| Tropical Asia and Pacific | 2 | 125 | −0.3 | 0.3 |
| Non-tropics | 3 | 8 | −0.1 | 0.0 |
| 4. Post-transition | 105 | 2305 | 4.7 | 8.2 |
| Tropical Americas | 17 | 77 | 0.0 | 0.2 |
| Tropical Africa, Middle East and Europe | 27 | 150 | 0.6 | 0.5 |
| Tropical Asia and Pacific | 20 | 189 | 0.8 | 0.7 |
| Non-tropics | 41 | 1889 | 3.3 | 6.7 |
3. Results
Below we present, in turn: the total amount of deforestation attributed to expanding cropland, pastures and forest plantations across the tropics and sub-tropics; the commodities most commonly implicated in forest loss across countries and regions; the role of domestic versus export demand in driving forest loss; and the role of trade in shifting pressures on forests across countries at different forest transition stages. Results are generally presented as averages over the case study period (2005–2013), but where there are distinct and relevant temporal trends in the data these are discussed (temporal trends can also be explored in the full results dataset, available in the supplementary material).
In total, between 2005 and 2013, our land-balance model attributed an average of 5.5 Mha yr−1 of forest loss across the tropics and sub-tropics (62% of the total) to expansion of the agricultural and forestry land uses included in this study. Unattributed forest loss averaged 3.4 Mha yr−1 (38%) and is likely due to a mix of causes, primarily logging and natural forest loss (e.g. forest fires)8 .
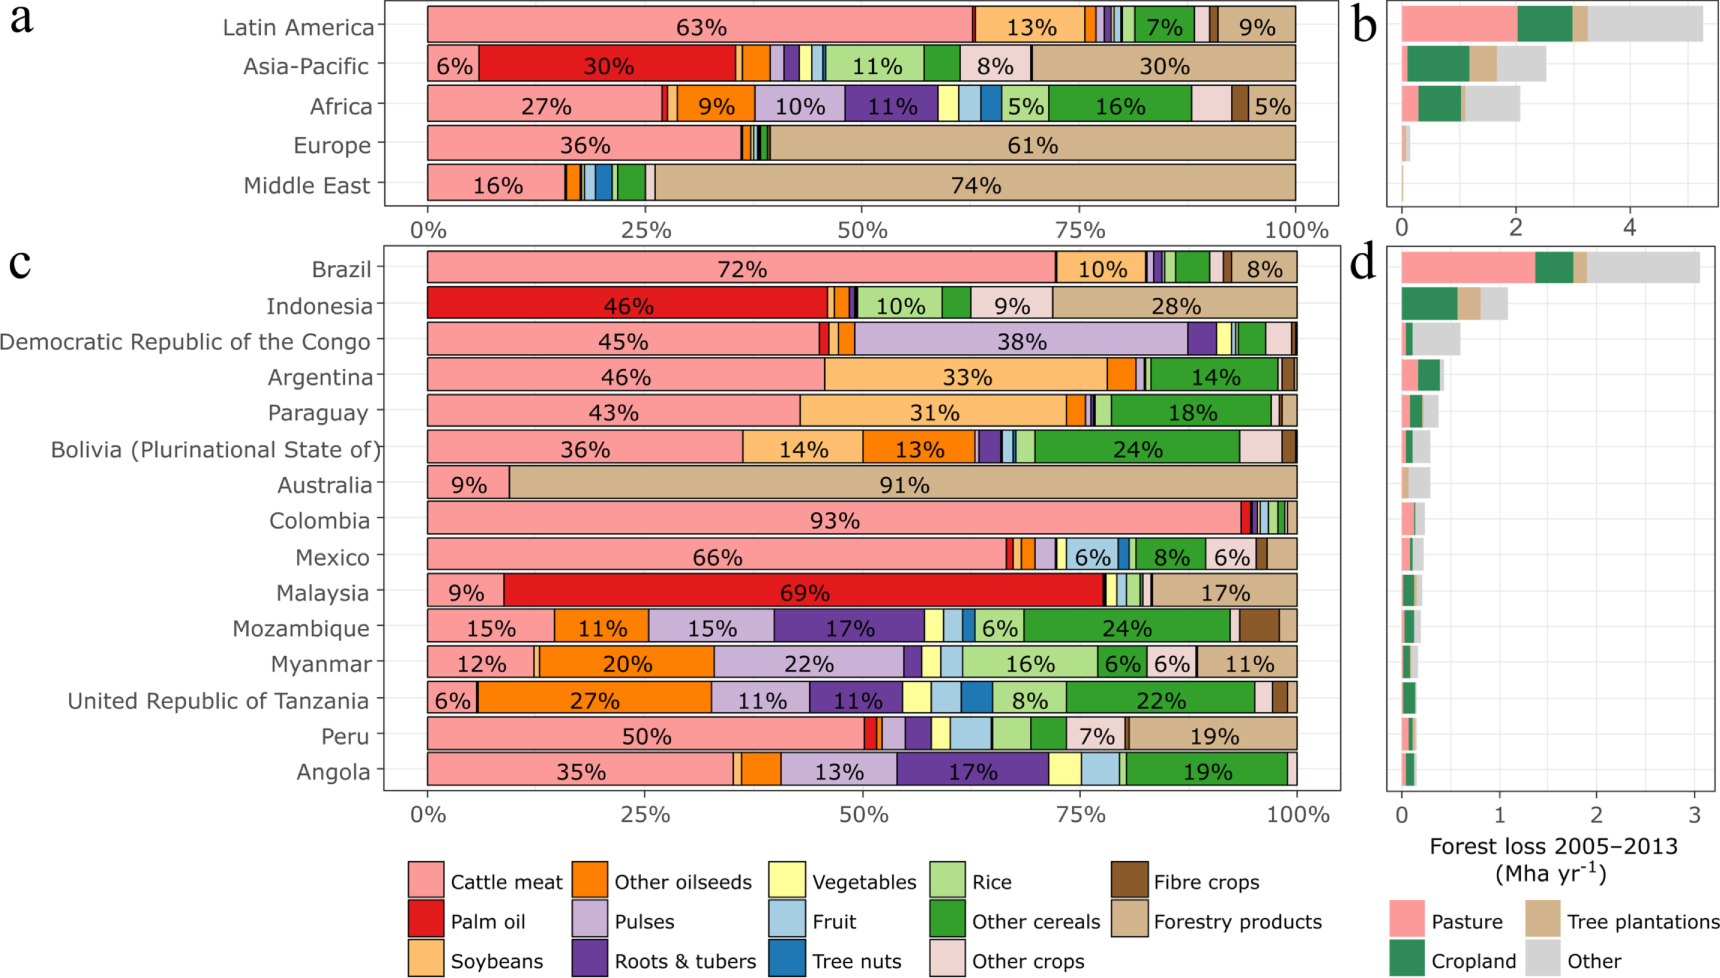
Overall, the attribution of embodied deforestation is heavily dominated by a handful of countries (figure 3): Brazil and Indonesia together accounted for almost half (44%) of the deforestation attributed to expanding cropland, pastures and tree plantations, followed by Argentina and Paraguay, that accounted for 7% and 4% respectively. All remaining countries each account for less than 3% of the total embodied deforestation.

Figure 3. The commodities driving deforestation vary between continents (a) and countries (c). The proportion of embodied deforestation attributed to each of the commodities/commodity groups is shown for (a) continents and for (c) the 15 countries with the largest average forest loss 2005–2013. The total average forest loss per (b) continent and (d) country is broken down by broad land-use categories as well as the forest loss that remains unattributed in our land-balance model ('other'). The tropical and sub-tropical countries included in the forest loss attribution analysis, are shown in figure S1.
Download figure:
Standard image High-resolution image3.1. Deforestation embodied in production—country and commodity variation
Attributed forest loss was also dominated by a few commodities, with more than 40% of the embodied deforestation associated with expanding pastures for cattle meat production (2.2 Mha yr−1). Other commodities/commodity groups found to be associated with a large share of deforestation were forestry products (0.8 Mha yr−1), palm oil (0.4 Mha yr−1), other cereals (0.4 Mha yr−1) and soybeans (0.4 Mha yr−1), together accounting approximately for another 40% of total embodied deforestation.
However, the commodities associated with forest loss vary greatly between countries and continents (figure 3): in Latin America, cattle meat accounted for more than 60% of the embodied deforestation, whereas in Asia-Pacific palm oil and forestry products each accounted for around a third of the embodied deforestation. In Africa, cattle meat contributed just over a quarter, and the remainder was a diverse mix of other cereals, roots and tubers, pulses and other oilseeds. But there is also large country variation within these broad regional trends: for example, in Brazil, cattle meat dominates (72%) the embodied deforestation, whereas in Argentina and Paraguay, it accounted for just under half, and soybeans accounted for around a third.
Although traditional tropical export crops—such as rubber, sugar, coffee, cacao—overall contributed little (<5%) to deforestation embodied in production, they did make a larger contribution in a handful of countries. An analysis of expansion of different cash crops showed that this was mainly due to rubber in Asian countries (Thailand, Vietnam, Indonesia), coffee and cacao in some African countries (Liberia, Uganda, Congo, Ethiopia, Cameroon, Madagascar), and coffee in some Latin American countries (Honduras, Ecuador, Peru) (table S4).
3.2. Deforestation embodied in consumption—domestic versus international demand
While deforestation was mainly driven by domestic demand, in total 26% of the embodied deforestation was exported. Again, there were large variations between countries and commodities (figures 4 and S8). Overall, in countries with—on average—larger farm [45] and forest loss patch [44] sizes, deforestation embodied in production was exported to a larger extent (table S3).
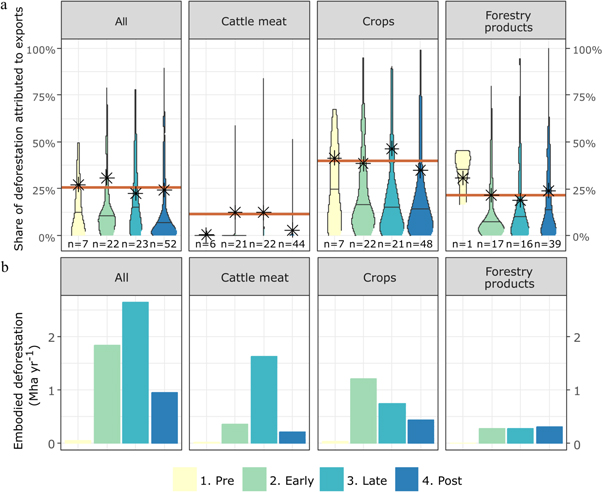
Figure 4. The (a) share and (b) amount of deforestation embodied in production that was exported varied between countries in different forest transition stages and between commodities (see figure S8 for results by individual crop groups). Unclassified countries not shown as the amounts were very low. (a) Distribution of the share of deforestation attributed to exports for the countries within each forest transition stage. The number of countries in each group indicated by n (for each country there are 9 observed values, one for each year in 2005–2013; countries were only included if they had deforestation attributed to the commodity group in question at some point during the time period). The violins' lengths show the range of export shares, while the width indicates where most of the countries' values lie. The median is shown with the horizontal black line within the violin, whereas the stars show the forest-loss area weighted average (i.e. the export share for the total deforestation in each the forest transition stage). The red horizontal line shows the area-weighted average for all countries. The median value for cattle meat (of all countries) was extremely low (near 0), with only 23 countries exporting more than 5% at some point between 2005 and 2013. This results in the thin lines (rather than visible violins) for cattle meat. (b) The amount of embodied deforestation in each category per forest-transition stage.
Download figure:
Standard image High-resolution imageIn total, the share of deforestation attributed to exports was greatest for crops (40%), with some—palm oil, soybeans, tree nuts and other crops—primarily destined for export (63%–77%). Palm oil and soybeans each accounted for just over a fifth of total deforestation embodied in trade. Deforestation for cattle meat, on the other hand, was primarily for domestic demand, with only 11% for exports in total. However, as such a large share of deforestation was attributed to expanding pastures, cattle meat still constituted 18% of the total deforestation embodied in exports.
Deforestation embodied in palm oil, soybeans and other crops were primarily sourced from early-transition countries and a few late- and post-transition countries. Cattle meat and soybeans were particularly exported from some late-transition countries with decreasing, but still high, deforestation rates (mainly Brazil and Argentina, but also a few other Latin American countries). There was also some deforestation attributed to export from a few post-transition countries (embodied in palm oil from Malaysia in particular, and e.g. forestry products from Vietnam) that maintained high gross forest loss rates even though the net forest area is stable or increasing.
For the early-transition countries, a third of embodied deforestation was exported, but most of those exports (0.5 out of 0.6 Mha yr−1) originated from just two countries: Indonesia, with an export share of 48%, and Paraguay, with an export share of 65%. In most other early-transition countries embodied deforestation primarily served domestic demand. For late- and post-transition countries, around a quarter of the total embodied deforestation was exported, though again there was a lot of variation between countries (between 0% and 78% for late-transition countries, and between 0% and 90% for post-transition countries). Amongst the pre-transition countries, only Papua New Guinea (with 24%–50% range between years), exported more than 35% of its embodied deforestation. On the whole, a substantial share of total deforestation embodied in production was exported across the different forest-transition groups and, while there was no significant difference in export shares between the stages, there were large variations between the countries within them, with much of deforestation embodied in exports originating from comparatively few high-deforestation countries where foreign demand was particularly important.
Similarly, although the total share of deforestation attributed to cropland being exported (40%) was twice the share of total cropland area embodied in exports (20%) (figure S6), this difference was mainly driven by a handful of countries: on the one hand, the high share of deforestation attributed to export can largely be explained by Indonesia, Brazil and Argentina, which together account for almost half (44%) of deforestation embodied in crop production, and export between 49% and 76% of this (table S5). On the other hand, the comparatively lower share of cropland attributed to exports is dominated by India, accounting for a quarter of total embodied cropland while only exporting 8% of this (table S6). Thus, there was no general tendency for countries to export a greater share of embodied deforestation than of embodied cropland (figure S10), but our results show that tropical countries with high deforestation rates dominate the exports of embodied deforestation.
Looking at the total consumption-related deforestation, i.e. the imports plus the domestic consumption of embodied deforestation (calculated as the total production in the country minus any exports), the largest consumer countries were primarily those with much domestic deforestation. Brazil was—by far—the largest consumer of embodied deforestation, irrespective if total or per capita consumption were considered (figure S12). The rest of Latin America also had high levels of consumption. In Asia-Pacific, the largest consumer countries were Indonesia (primarily domestic), China (imports only) and India, although from a per-capita perspective only Indonesia lies in the higher end, while China and India have amongst the lowest per-capita consumption of embodied deforestation globally (1 m2 capita−1 yr−1). For Africa as a whole, the consumption of embodied deforestation was not negligible: in total, it was on par with that of Latin America excluding Brazil (1 Mha yr−1), and per capita (9 m2 capita−1 yr−1) it was only surpassed by the Latin American countries and Indonesia. Russia, the European countries as well as the rest of Asia-Pacific had similar levels of per-capita consumption of embodied deforestation (6 m2 capita−1 yr−1), while the US consumed less (2 m2 capita−1 yr−1).
While the amount of deforestation embodied in production and trade fluctuated over the 2005–2013 period (figures S5 and S6), it showed a slightly increasing temporal trend. The share of embodied deforestation attributed to exports particularly increased for early-transition countries overall (though with large variations for individual countries), and while the total amounts of embodied deforestation decreased in the second half of the time period, the exported amounts remained fairly constant. Embodied cropland did not see a corresponding increase in exported share, potentially indicating an increasing role of foreign demand for forest-risk commodities relative to other commodities.
3.3. Deforestation displaced—trade and forest transitions
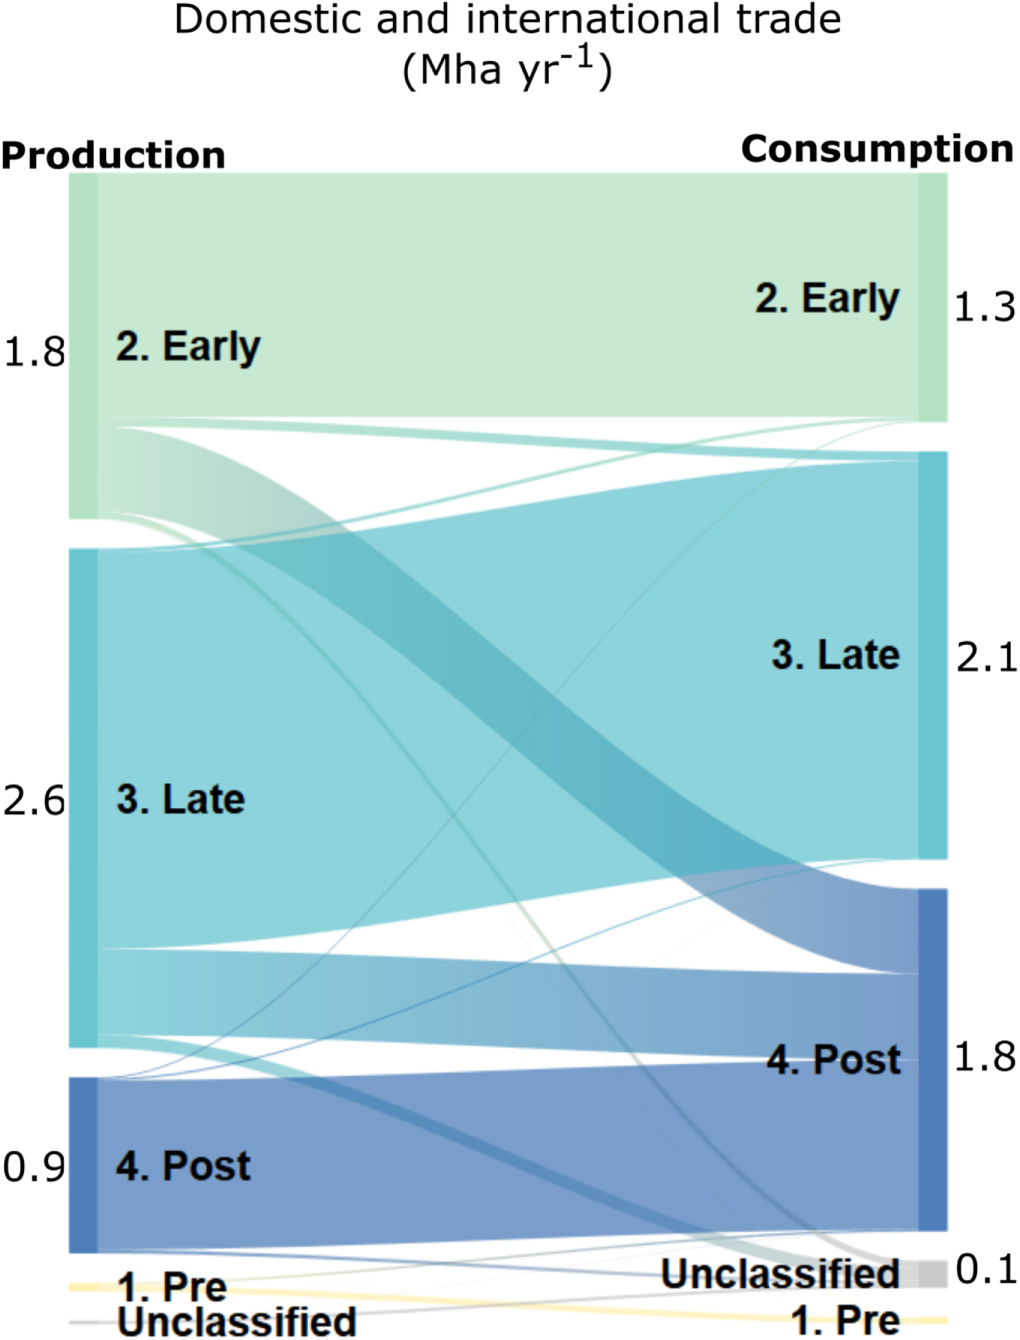
The vast majority (79%) of the exported deforestation ends up being consumed in countries that are increasing their forest cover (post-transition countries). Late-transition countries consumed another 8% of the internationally-traded deforestation. The largest export flows went from early- and late-transition countries to post-transition countries (figure 5), and the exported deforestation from pre-transition countries was primarily consumed in post-transition countries in Europe (figure S12(a)).

Figure 5. Trade flows of deforestation embodied in domestic consumption and international trade aggregated by forest transition stage. The left-hand side shows the area of deforestation embodied in production, while the right hand side shows the deforestation embodied in consumption. While most deforestation was embodied in production of agricultural and forestry commodities in early- and late-transition countries, most (79%) of deforestation embodied in export was consumed in post-transition countries. Unclassified countries consumed 9% of deforestation attributed to export.
Download figure:
Standard image High-resolution imageA handful of countries accounted for a large part of the import and consumption of embodied deforestation. Of the top 10 importing countries—accounting for half of the imports—8 were post-transition countries, with much of the imports consumed in Europe and Asia-Pacific (table S7). China, India, Russia and the US were the four individual countries with the most imported deforestation, together accounting for about a third of the total imports.
With post-transition countries consuming most of the deforestation embodied in trade, the gains in forest cover in these countries have been partly offset by deforestation elsewhere (figure 6(a)). In many cases, deforestation embodied in imports actually exceed or is comparable to the net domestic forest-area in the importing countries. For example, between 2010 and 2013 the United Kingdom imported 31 kha yr−1 embodied deforestation, exceeding the 17 kha yr−1 net increase in forests inside the country. For Malaysia, the 22 kha yr−1 imported deforestation also exceeded the 14 kha yr−1 domestic net reforestation (which also conceals substantial gross loss of primary forests still happening in the country). For India the imports of deforestation offset 58% of the 178 kha yr−1 reforestation gains.

Figure 6. (a) For many (post-transition) countries with returning forest cover, the imports of embodied gross deforestation were comparable to, or exceeded, the area of forest gained by net reforestation (based on FAO FRA 2015). (b) Of the late-transition countries with decreasing trends in gross forest loss, ten increased imports of embodied deforestation (2010–2013 compared to 2005–2009), while ten (not shown) decreased imports. The diagonal lines mark the equilibrium between (increased) imports of embodied deforestation and reforestation (a) or decreased forest loss (b).
Download figure:
Standard image High-resolution image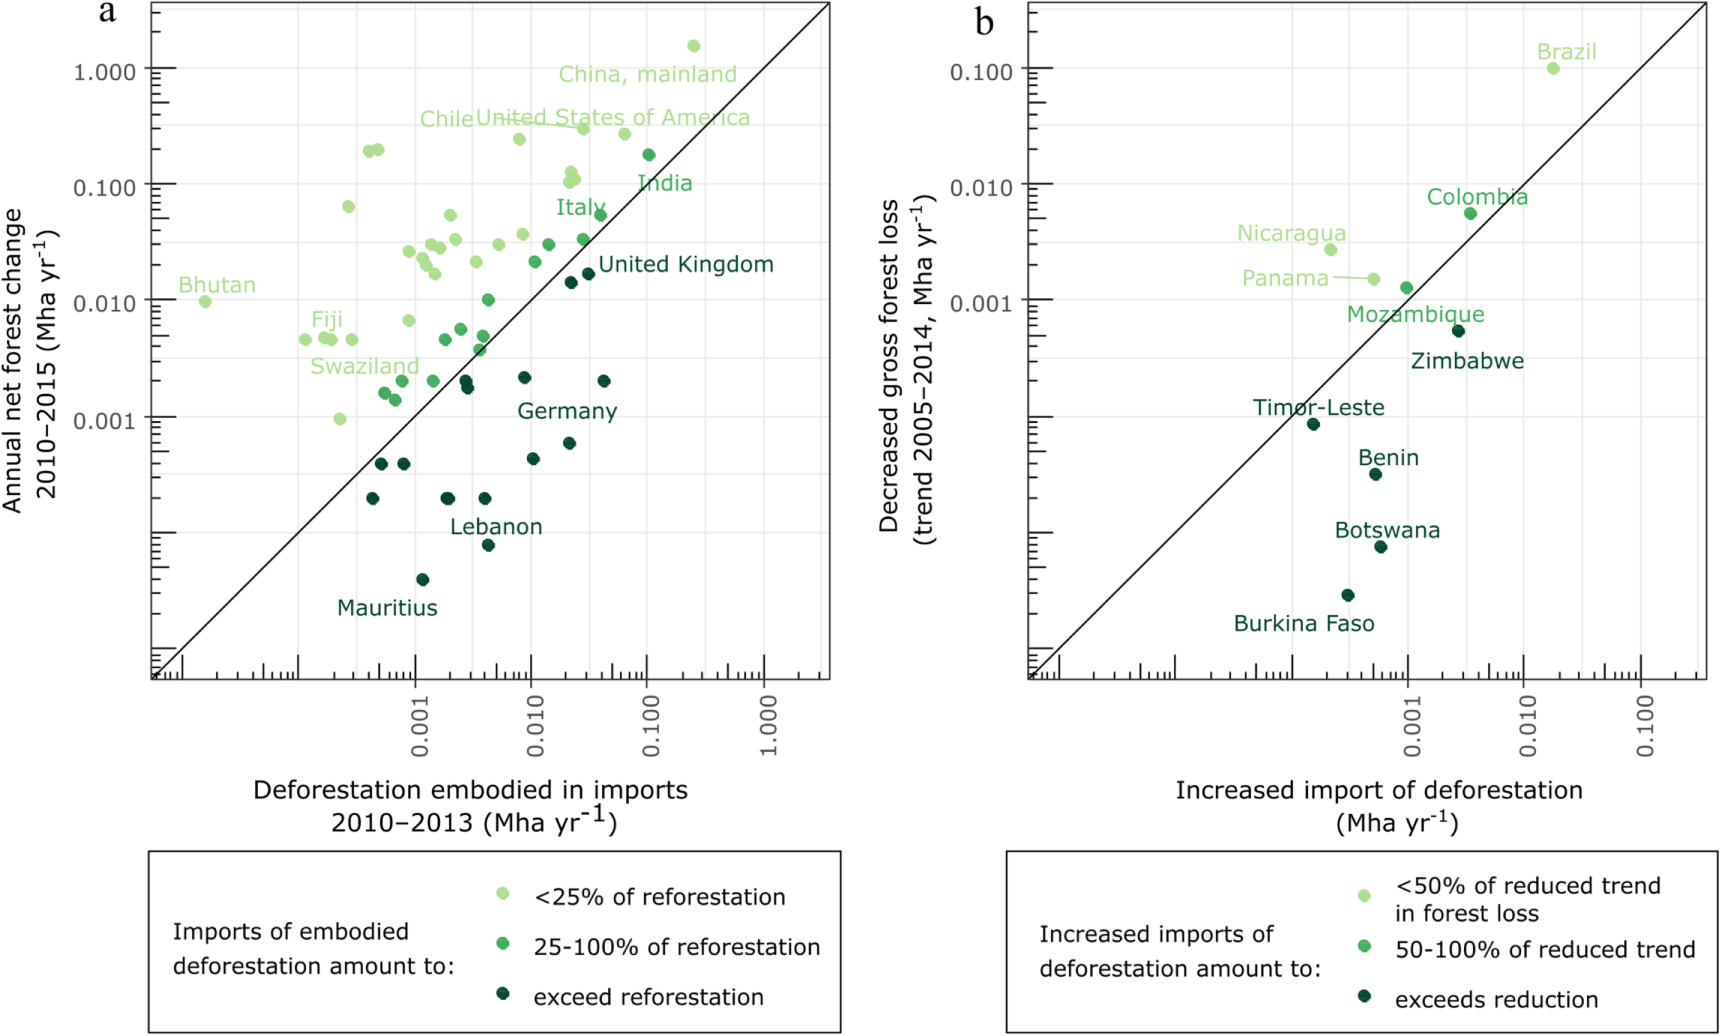
In total, for all post-transition countries, a third of the net reforestation gains were offset by imports of embodied deforestation from elsewhere. If one looks specifically at the post-transition countries that have pledged to reforest cleared or degraded forest land under the Bonn Challenge, the share of current reforestation offset by imports of embodied deforestation was even slightly higher (36%), and while absolute deforestation embodied in imports was still small relative to committed reforestation targets, so was 2010–2015 net forest gain in these countries (table S8). This suggests that forest transitions in many cases have in part been enabled by not only importing land-demanding products from abroad, but also by displacing some of the deforestation, and concomitant environmental impacts, to other countries.
For the 20 late-transition countries that decreased their gross forest loss 2005–2014, half (10) increased their imports of embodied deforestation (figure 6(b)), while the other half decreased their deforestation imports. Among the 10 countries which were increasing their imports, there were a few countries where imports of embodied deforestation increased more than the reduction in deforestation (e.g. Zimbabwe, for which the trend in gross forest loss was 0.5 kha yr−1 while imports increased by 2.7 kha yr−1), in total offsetting 24% of reduced deforestation. This offset decreases to 11% if the 10 countries that reduced their imports of embodied deforestation are included.
4. Discussion and conclusions
Here we have presented a dataset quantifying the contribution of expanding agriculture and tree plantations to forest loss in the tropics and subtropics, and further followed these commodities and the embodied deforestation to countries of apparent consumption. The approach taken is by nature coarse, departing mainly from national level statistics, which implies that we cannot clearly separate direct and indirect drivers of deforestation (i.e. between land uses directly expanding on cleared forest land versus those pushing other land uses into the forest). A case in point is Australia, where cattle ranching has been the main driver of forest loss [46], but where the aggregate reduction in pasture area across the continent implies that our land-balance model does not attribute deforestation to this land use, but instead to expanding forest plantations (see figure 3). This is a strong reason for running the land-balance model at finer (i.e. subnational) geographical scale to better relate forest loss to actual land use dynamics. In this paper, the subnational level analysis done for Brazil and Indonesia provides an improvement over running the analysis at national level, by better attributing forest loss to the commodities that are expanding in the areas where forest loss occurred. For example, the subnational approach attributes more forest loss to soybeans in Brazil and less to rice in Indonesia, than would a national level approach (for details, see the supplementary materials).
Despite the discussed limitations above, we judge the result presented here to be an improvement upon other recent studies assessing deforestation drivers across the tropics, such as Lawson [16] and Hosonuma et al [42], both based on extrapolation of qualitative estimates of the share of deforestation attributed to agriculture from a subset of tropical countries. In comparison to these earlier studies, we attribute less forest loss to expanding cropland, pastures and forest plantations: just over 60% of total tropical forest loss in the period 2005–2013, compared to 70% of deforestation as suggested by Lawson [16] and 80% as suggested by Hosonuma et al [42]. The total amount of deforestation attributed to pasture and cropland (4.5 Mha yr−1) is similar to estimates of commodity-driven deforestation (5 Mha yr−1) (defined as permanent conversion of forest and shrubland to agriculture, mining, or energy infrastructure, excluding shifting cultivation) by Curtis et al [47], using a spatial forest loss classification model.
The confidence in the results presented here is also strengthened by their agreement with more detailed studies (e.g. [48–52]) of deforestation drivers in specific countries and regions in the tropics (including for our sub-national analysis for Brazil and Indonesia). Also in line with previous work, our results show that comparatively few 'forest-risk' commodities—primarily cattle meat, soybeans, palm oil and forestry products—are associated with a large share of the deforestation (these commodities account for 70% of the deforestation attributed to expanding agriculture and forestry products in our land-balance model). Our estimates of the amount of deforestation embodied in the production of these commodities in main forest loss countries in Latin America (Argentina, Bolivia, Brazil, and Paraguay) and Southeast Asia (Indonesia, Malaysia, and Papua New Guinea) agree reasonably well with the results presented by Henders et al [14], who base their estimates of deforestation attribution primarily on remote-sensing analyses. The biggest difference is that we allocate less deforestation to expanding pastures in Brazil and Paraguay (but more in Argentina). Partly this may be explained by the Henders et al [14] results in these cases being based on less robust data9 , but it might also suggest that we are instead attributing some deforestation to expanding cropland indirectly pushing cattle ranchers into the forest (despite trying to capture these dynamics in the land-balance model).
With this pan-tropical dataset on deforestation drivers, we were able to assess changes in forest dynamics—as countries move along the forest transition curve—and relate them to imports of embodied deforestation. One striking key result is that post- and late-transition countries account for 79% and 8%, respectively, of imports of deforestation embodied in trade. On average, these imports offset a third of recent forest gain on average in post-transition countries. For as many as 16 post-transition countries, reforestation is more than offset by deforestation caused by imports.
We find the numbers for the offsets of reforested area surprisingly high. They are in the same order of magnitude as those found by Meyfroidt et al [12] analyzing land use (which we would expect to be significantly lower than for land-use change) embodied in trade, as well as those of Kastner et al [13], analyzing carbon embodied in trade. However, these results are not directly comparable. For instance, the results presented by Meyfroidt and colleagues are based on net land-use displacement, entailing that land use embodied in imports to a large part is offset by exports, the amounts of which are often significant for many post-transition countries (which we also find—see figure S5). This is not the case to the same extent for embodied deforestation (net imports of deforestation in post-transition countries still offset a quarter of reforestation, i.e. only slightly less than the third offset considering gross imports).
There might also be other reasons to why we find such high share of reforestation in post-transition countries being offset by imports of embodied deforestation. One is that we find that total deforestation embodied in production is exported to a greater extent than cropland area embodied in production, though this is mainly driven by differences from a few major agriculture-producing countries. Another reason might be the country selection: imports of embodied deforestation offset less—just under a fifth—of reforestation in the seven post-transition countries analyzed by Meyfroidt et al [12]. Finally, we study a more recent time period: we should expect forest gain in post-transition countries to saturate and level off10 , while total land demand—if incomes continue to increase and diets shift towards more land-demanding products such as meat—can continue to increase, implying that the share of reforestation offset by deforestation embodied in consumption should be expected to increase over time. Indeed, that is also what Meyfroidt et al [12] find for land use. We also know that exports of the main forest risk commodities from major deforestation countries have increased dramatically in the last decade [14].
Ideally, to evaluate the net effect of a local forest transition on global forest area, one should therefore integrate the net effect of local forest gain and forest loss embodied in imports over time. However, our short time series (and the fact that the forest transition in many post-transition countries pre-dates this time series) makes this impossible for our analysis. Additionally, an ideal analysis would consider not only the area of forests lost and gain, but also the relative impact of these on e.g. carbon stocks, water, biodiversity (which typically will be larger per hectare in tropical countries exhibiting forest loss than in temperate and boreal countries currently reforesting) and other environmental, social and economic factors [7].
Moreover, it is important to note that our analysis does not say anything about causality: i.e. while we find that a large share of reforestation in post-transition countries is offset by deforestation embodied in imports, we cannot conclude that these imports were caused by the increased domestic reforestation efforts (leakage proper [53]). The forest transitions literature typically makes a distinction between an economic development path to forest transitions (economic growth pulling labor out of agriculture, leading to abandonment of agricultural land and forest regeneration) and a forest scarcity path (reforestation occurring in response to extensive negative impact of forest loss) [6, 53]. Likely, the causality is different depending on the forest transition path: where the forest transition is prompted by forest scarcity, increased imports may be a way of facilitating a local or national forest transition (i.e. leakage), whereas for the economic development path, economic growth may be causing both reforestation and increased imports of forest risk commodities—beef, soy for feed, palm oil in processed products, coffee, tea, cacao, etc—resulting from increased per capita incomes. Both these mechanisms may of course be at play simultaneously, and further research is needed to disentangle the relative strength of these different effects across countries [53].
Understanding these mechanisms is of vital importance if we are to significantly scale up reforestation efforts globally—in line with the goals of the Bonn Challenge—without this simply resulting in a counteracting increase in trade of embodied deforestation. Our results clearly underscore the point made by Pfaff and Walker [10], that achieving a global forest transition will be substantially more challenging than achieving local or regional forest transitions, as we have nowhere to displace our increasing land demand globally. Meeting the double challenge set up by the New York Declaration on Forests, the SDGs and the Bonn Challenge, to halve and ultimately halt deforestation while simultaneously restoring degraded and cleared forests, thus necessitates an ability to monitor and mitigate displacement of deforestation as countries move along the forest transition curve. We hope that the data presented here can facilitate policy to that end, be it through private supply-chain sustainability initiatives [54], public forest conservation policy, or a mix of the two [55].
Acknowledgments
This work was funded through the PRINCE project (www.prince-project.se), supported by the Swedish Environmental Protection Agency and the Swedish Agency for Marine and Water Management under a Swedish Environmental Protection Agency research grant (Environmental Research Appropriation 1:5); FORMAS grant 213:2014-1181; Formas grant 2016-00351 under the project LEAKAGE: Deutsche Forschungsgemeinschaft (DFG, German Research Foundation) project no. KA 4815/1-1; and support from the Gordon and Betty Moore Foundation through the Trase.earth program.
Footnotes
- 5
Note that if total expansion of all crops and crop group aggregates is less than total cropland expansion, some deforestation attributed to cropland will be classified as unexplained; conversely, if the sum of expansion of all crops/crop groups is larger than total cropland expansion (e.g. due to increased multi-cropping, or if one crop is replaced for another, which can entail that the reduction in area of one crop 'cancels out' the expansion of the other in terms of total cropland area change), total deforestation attributed is capped at the total amount attributed to cropland expansion.
- 6
Note, though, that large countries might exhibit diverging regional trends in forest cover loss and regeneration that are not captured by this country-level classification [41].
- 7
Estonia, South Korea, Portugal and Sweden [7].
- 8
We tested if the share of deforestation left unattributed was larger in countries with smaller forest clearing patches [44] or farm sizes [45], but found no support for such a relationship, indicating that smallholder clearing overall is well captured by our land-balance model (see supplementary material for details).
- 9
For Brazil, Henders et al assume that 80% of deforestation is for expanding pastures, based on a study by Bustamante et al [51] that attributes deforestation on municipal level based on pasture area (as share of total agricultural area), and not on pasture expansion.
- 10
FAO data [4] do show net forest gain in post-transition countries increasing from the 1990s to 2005–10, but the decreasing substantially in the 2010–15 period.